|
IV - Examples of the Various Blockage Scenarios
In the following scenarios the airspeeds will be rounded to the nearest 5 knots for convenience. We will be using the Pitot static system simulator available here on our site to run them. The simulator is setup like the Pitot-static system in most general aviation airplanes and is similar to the one described in chart 2-1. The transponder is not depicted here for simplicity, but the transponder would have the same behavior as the altimeter when set for pressure altitude 29.92 inHg. The simulator will have a "Simulated System" and a "Reference System". The "Reference System", which is not affected by the blockage scenarios, is used to compare the blockage scenarios we apply in the "Simulated System".
The scenarios are also set to happen in standard atmosphere to make it easier to quantify. Also, the effects of these scenarios are summarized in table 1. In situations other than standard atmosphere, the indications on the instruments will be different, however, the general behavior will be the same.
1a. Static port blocked, but ram air and Pitot tube drain remain unobstructed.
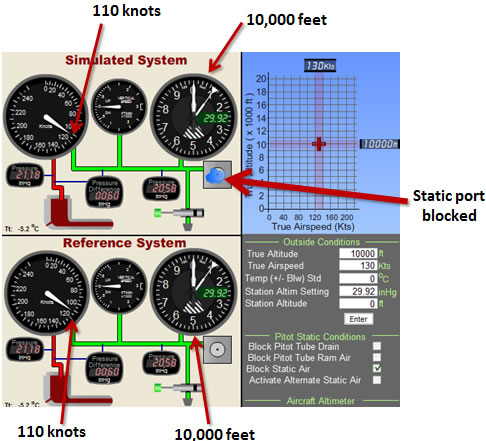
Fig 4-1 Static port gets blocked at an altitude of 10,000 feet and 130 knots.
In this example (Fig 4-1), the aircraft is at an altitude of 10,000 feet and flying at 130 knots (true airspeed). The indicated airspeed is 110 knots (note: due to altitude and atmospheric conditions indicated airspeed is different than true airspeed) and the altimeter reads 10,000 feet. Let's assume now that a blockage occurs on the static port. If the aircraft stays at the same altitude and maintains airspeed there is no difference seen in the instruments. Notice the pressure on the static port air line of 20.58 inHg (inches of mercury). This will be important because now air is trapped inside the static line which will cause an erroneous reading in the airspeed indicator when the altitude changes and will cause the altimeter and vertical speed indicator to freeze at the reading where the blockage occurred. Since the altimeter setting is 29.92 Chart 2-7 will confirm that the altimeter will read 10,000 feet for a pressure of 20.58 inHg. If there was a different altimeter setting the altitude on chart 2-7 would have to be adjusted using chart 2-5.
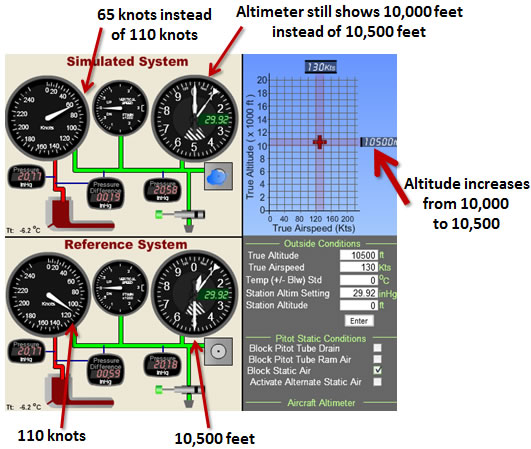
Fig 4-2 Increase in altitude after blockage.
Suppose that the pilot now climbs to an altitude of 10,500 feet (Fig 4-2) without changing true airspeed (the aircraft's actual airspeed). The altimeter and vertical speed indicator don't move because the pressure hasn't changed in the static air line. The airspeed indicator however is now showing 65 knots instead of 110 knots as seen in the reference system that is not blocked. In this scenario at the higher altitude there is less pressure in the outside air and as a result there will be less pressure in the ram air opening for the same true airspeed. Normally this would be compensated by a reduction in pressure P in the static air line which is connected to the static port (measures the static pressure outside). Because it is blocked the difference in air pressure between the ram air and static air (trapped at 20.58 inHg) is reduced: 20.77-20.58 = 0.19 inHg. This corresponds to 65 knots (see chart 2-3) and therefore the indicated airspeed on the aircraft's airspeed indicator is less than what it should be. In this case there is a 45 knot decrease in indicated airspeed with just a 500 foot increase in altitude. The correct difference (qc = PT - P) as seen by the reference system would be 20.77 - 20.18 = 0.59 inHg which corresponds to 110 knots indicated airspeed (see chart 2-3). Where 20.18 inHg is the static air pressure outside the aircraft at that altitude.
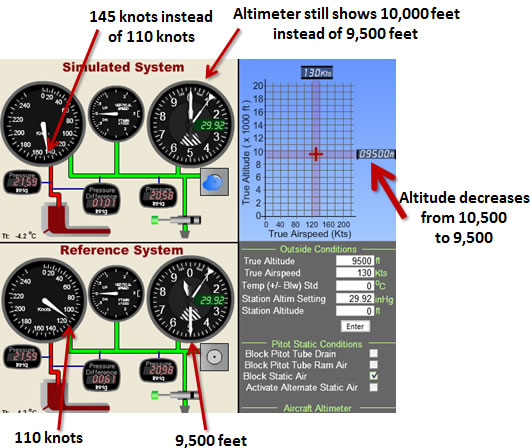
Fig 4-3 500 ft below altitude of blockage.
Now let's see what happens when the aircraft descends to 9,500 feet while maintaining true airspeed. This is 500 feet below the altitude in which the blockage of the static air port occurred (Fig 4-3). Here we have basically the opposite occurring. The indicated airspeed is showing 145 knots (an increase in 35 knots) instead of the correct 110 knots of indicated airspeed. The ram air pressure of 21.59 inHg is accurate because the ram air is not blocked. The pressure in the static air line, however, is still 20.58 inHg instead of the new 20.98 inHg which is the static air pressure at that altitude. Because the airspeed indicator is measuring the difference between the two of 21.59-20.58= 1.01 inHg which corresponds to 145 knots according to chart 2-3. The airspeed indicator displays a higher airspeed as a result. The reference system shows what the correct difference in pressure (qc = PT - P) would be: 21.59-20.98 =0.61 inHg which still corresponds to approximately 110 knots (see chart 2 -3) on the airspeed indicator. Note that the altimeter and vertical speed indicator will continue to be frozen and will remain that way unless the pressure in the static air line changes.
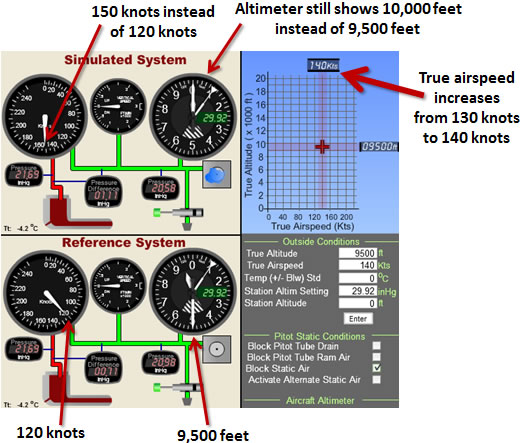
Fig 4-4 Airspeed is lower than indicated but indicated still increases with airspeed.
If the speed of the aircraft increases there will continue to be an increase in the airspeed shown by the airspeed indicator but the reading will be incorrect (Fig 4-4). If the aircraft is below the altitude at which the blockage of the static port occurred, as in this example, the indicated airspeed will be higher than it actually would be if there was no blockage. We have the aircraft flying at 140 knots true airspeed which would correspond to an indicated airspeed of 120 knots at present atmospheric conditions. Due to the blockage the airspeed indicator shows 150 knots instead of 120 knots. You can use chart 2-3 to verify this with the pressure difference 21.68 - 20.58 = 1.11 inHg. The opposite (not shown) would occur if the aircraft was flying above that altitude.
.

Fig 4-5 Decrease in indicated airspeed to match indicated airspeed before blockage.
If the pilot were to instead reduce the airspeed, perhaps not realizing the problem, the aircraft could slow down too much and stall or spin. Here (Fig 4-5) we have the pilot slowing the aircraft down until the indicated airspeed shows 110 knots (which was the original indication at the time of the blockage). You can use chart 2-3 to verify this with the pressure difference 21.11 - 20.58 = 0.53 inHg. Looking at the reference system we can see that the aircraft is actually at 55 knots indicated airspeed which could be dangerously slow. Chart 2-3 can once again be used to verify this with the pressure difference (qc = PT - P): 21.11 - 20.98 = 0.13 inHg. Here, a mere 500 feet below the altitude at which the blockage occurred causes the indicated airspeed to be 110 - 55 = 55 knots less than what it should be, or half in this case!
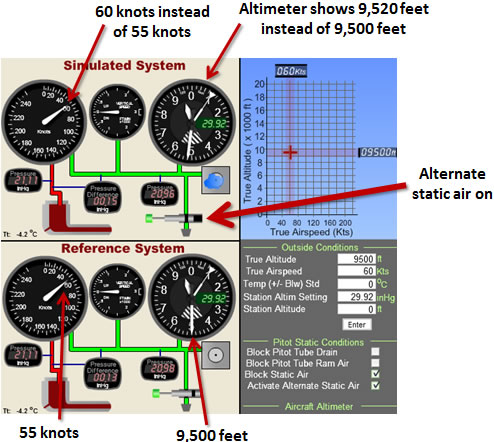
Fig 4-6 Activating alternate static air port.
All this time the altimeter and vertical speed indicator were frozen. If a pilot realizes that there is something wrong and suspects an issue with the static port he/she can activate the alternate static air (Fig 4-6) and get the instruments to work again. There may be a slight difference in reading since the placement of the alternate static air port may cause its pressure to be slightly different than an unobstructed static port. In this our example we will suppose the static port gives a very slightly lower pressure. The indicated airspeed is now 60 knots. Chart 2-3 can again be used to verify this with the pressure difference: 21.11 - 20.98 = 0.15 inHg. This is only 5 knots higher than the airspeed shown in the reference system which is much better than the 55 knot difference the pilot experience before. The aircraft's altimeter is also working and showing 9520 feet (only a 20 foot difference from the altitude in the reference system). The vertical speed indicator would also be working again.
|