|
Altimeter
The altimeter (essentially another pressure gauge) is connected to the static air port (the port that measures outside atmospheric pressure) and displays an altitude based on the static pressure and the adjustment of the altimeter setting knob (Kollsman window). The altimeter's pressure measurement instrument design will measure absolute pressure (or pressure relative to a vacuum) in contrast with the airspeed indicator that measures relative or (gauge pressure). The altimeter instrument is only affected by a static port blockage since it uses the static air pressure only. This instrument is calibrated so that it would read true altitude in standard atmospheric conditions. The altimeter setting knob provides an approximate correction for nonstandard pressure.
| |
Pressure (Static) vs Pressure Altitude

|
|
Chart 2-4
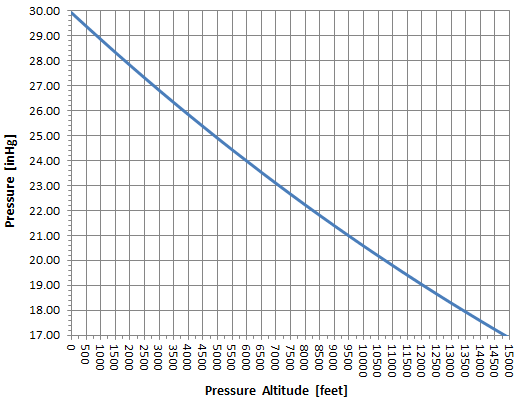
Chart 2-4 relates pressure altitude in feet to the outside or static pressure P at sea level in standard atmosphere. This is essentially how the Altimeter is calibrated.
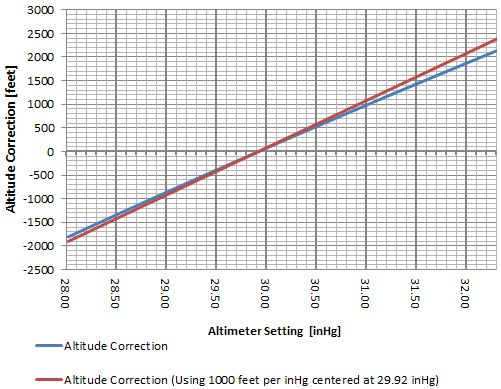
If you were building an altimeter that measures pressure altitude using a pressure gauge, chart 2-4 could be used to mark altitudes corresponding to each of the pressures on the pressure gauge scale. Next you could connect this gauge to the static port and now you have an altimeter which measures pressure altitude. If you wanted however to take into consideration nonstandard pressure, the blue curve on chart 2-5 would show how much you would have to add or subtract to your pressure altitude reading in order to obtain an indicated altitude (pressure altitude corrected for nonstandard pressure). Usually aviation approved altimeters mechanically or electronically offset the altitude scale when turning the altimeter setting knob so that the altitude will be offset according to it.
| |
Altitude Correction for Altimeter Setting

|
|
Chart 2-5
Chart 2-5 shows the correction that is applied when inputting the altimeter setting in the Kollsman window. A rule-of-thumb approximation is shown by the red curve which is of 1000 feet for every 1 inHg away from 29.92. Pilots often use this to estimate pressure altitude given the altimeter setting. The altimeter, however is calibrated with the more precise calculation shown by the blue curve.
| |
Error if Using 1000 Feet per inHg
Centered at 29.92 inHg 
|
|
Chart 2-6
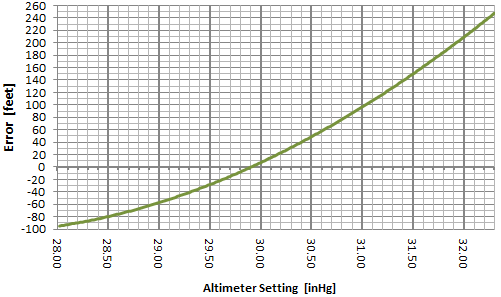
For the sake of comparison, chart 2-6 shows the error when the red curve assumption is made in chart 2-5. Record lows and highs are around 28.2 inHg and 32.1 inHg respectively. It can be seen through this chart that at extremely high pressures a pilot could be off by about +250 feet if using the 1000 feet per inHg rule-of-thumb. In extremely low pressures the error could be about -90 feet.
| |
Pressure (Static) vs Pressure Altitude

|
|
Chart 2-7
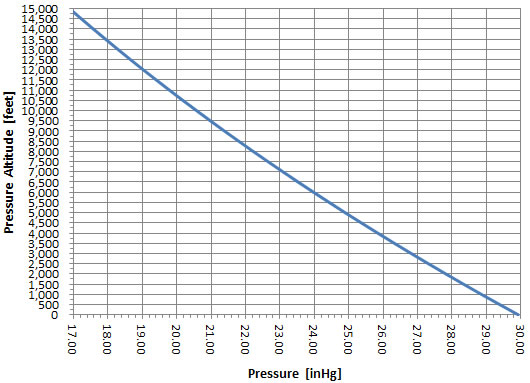
Chart 2-7 is the inverse of chart 2-4. It plots the altitude based on pressure for standard atmospheric conditions. Chart 2-7 will be used to later when we discuss blockages and the resulting effect on the altimeter.
|

