|
Mentally Calculating the Wind Correction Angle (cont.)
V - Techniques for visualization of wind during flight
During flight the pilot will need to visualize where the wind is in relation to the aircraft's heading and course. The following are a few suggestions on how to do this and figure out what the AWA is.
Heading bug
Fig 3 Heading bug on heading indicator (a), analog HSI (b) and digital HSI (c).
If the heading bug (figure 3) is not being used by the autopilot, or for other reasons, the heading bug can be set to remind the pilot where the wind is.
Visualizing the AWA before intercepting the course (CRS)
Fig 4 Visualizing the AWA using the heading indicator for a right head wind.
Figure 4 illustrates how a heading bug can be used on a heading indicator to remind the pilot where the wind is coming from. In this case the wind direction (WD) is from 090. If the course (CRS) that is going to be navigated is 040, for example, the pilot can visualize the 040 mark on the heading indicator to be that course. In this case wind is coming from the front (headwind), therefore the angle between the course (CRS) and the wind (WD) will be the acute wind angle (AWA). If the wind were a tail wind the AWA would be the angle between the reciprocal of the course (CRS+180) and the wind direction (WD).
Knowing the AWA allows you to calculate, using the techniques described in the previous paragraphs, the wind correction angle (WCA). Once the pilot has intercepted the course (CRS), the WCA can be added or subtracted from the CRS to determine the heading (HDG) that is required to maintain that course and compensate for the wind. In this particular example since the CRS is 040 and WD is 090, the AWA is 90-40 = 50o.
| |
 |
|
 |
|
| |
(a) |
|
(b) |
|
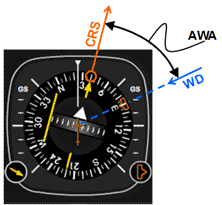
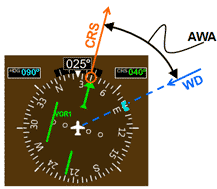
Fig 5 Visualizing the AWA using an analog (a) and digital (b) HSI for a right head wind.
Figure 5 shows how to visualize the above scenario's AWA on an analog and digital HSI. If for some reason the heading bug is being used for something else the pilot can make a mental note of where the wind is instead. Having a general idea of the wind is crucial to smooth and accurate navigation.
If the wind speed (WS) in this example is 40 knots and the aircraft's true airspeed (TAS) is at 110 knots. Calculate the wind correction angle (WCA).
First let's summarize the information we have and don't have:
CRS = 040
WD = 090
WS = 40 knots
AWA = 50o
TAS =
110 knots
WCAmax for a 10 knot wind= ?
WCA=?
To use our method of mentally calculating the wind correction angle (WCA) we have to first calculate and memorize the maximum wind correction (WCAmax) for a 10 knot wind at our typical true airspeed (TAS) of 110 knots.
The maximum wind correction angle is given by:
where WS is the wind speed, and TAS is the aircraft's true airspeed. Make sure your calculator is in DEG (degrees) mode. In the case even though the actual WS is 40 knots, we will use 10 knots to calculate our base (WCAmax) . Remember that we will only have to do this once, and then it will serve as the basis for any calculation of the WCA for our typical true airspeed.
This means that in the worst case scenario for a 10 knot wind when the wind direction is 90o in relation to our desired course, the wind correction angle (WCA) is 5o. Therefore WCAmax for a 10 knot wind = 5o.
Lets now calculate WCA given: WS = 40 knots; AWA = 50o. Begin by rounding the WS to the nearest multiple of 5, so for a WS of 40 knots, we already have it as a multiple of 5. Since the WS of 40 knots is four times the 10 knots we used to calculate the maximum wind correction angle (WCAmax), our maximum wind correction angle for this wind speed is going to be quadrupled: 5o x 4 = 20o. Next we look at the table on figure 2b and see what value is closest to 50o. If we use the table on the right, 50o is going to be a factor of 3/4 or 0.75. Therefore our estimated wind correction: WCA = 20o x 3/4 = 15o.
Visualizing the wind correction angle (WCA) once established on the course (CRS)
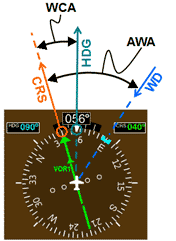
Fig 6 Visualizing the WCA once established on course (CRS).
The VOR instrument needle is centered once on course (figure 6). If at this point the aircraft is on the correct heading to maintain course (keep the needle centered), the difference between the course and this heading will be the wind correction angle (WCA). In practice, the pilot that has mentally calculated the wind correction angle will be able to estimate what this heading is by adding or subtracting the WCA to the CRS. In this case the wind is to the right of the course so the WCA will be added to CRS to get the heading (HDG). Specifically in the example above, the CRS is 040 and the mentally calculated WCA is 15o, therefore: HDG = 040 + 15o = 055.
Previously when intercepting the 040 course the pilot will maneuver in such a way that the aircraft will be at the 055 heading when the needle of the VOR instrument is centered. Once on course the pilot may have to make minor adjustments to the aircraft's heading in order to keep the needle centered. This is to correct for the actual wind which may be different than the forecast wind, or for an error in the mental calculation of the WCA. In this example, the exact WCA turns out to be 16o. This 1odifference is the minor adjustment that the pilot had to make. Therefore the pilot is now flying at a HDG of: 040 + 16o = 056.
| |
 |
|
 |
|
| |
(a) |
|
(b) |
|
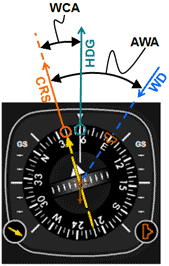
Fig 7 Visualizing the WVA and AWA using an analog (a) and digital (b) HSI.
Figure 7 shows how to visualize the above scenario's WCA and AWA on an analog and digital HSI.
Other examples for winds from other directions
Below are a few other examples of how to visualize wind correction angle (WCA) and acute wind angle to course line (AWA), for winds that are coming from other directions. The examples deliberately have the same AWA of 50o so that we can use the same WCA of 16o which was already calculated.
Example 2
Fig 8 Visualizing a right tail wind using a VOR instrument and the heading indicator.
| |
 |
|
 |
|
| |
(a) |
|
(b) |
|
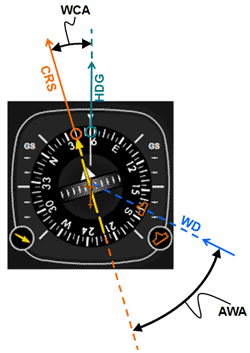
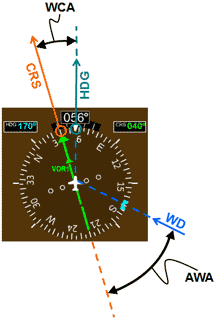
Fig 9 Visualizing a right tail wind using an analog (a) and digital (b) HSI instrument.
In figures 8 and 9 we have the following configuration:
CRS = 040
WD = 170 (right tail wind)
Reciprocal course (CRS + 180) = 220
AWA = 50o
WCA = 16o
HDG = 040 + 16o = 056
Example 3
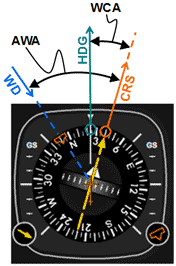
Fig 10 Visualizing a left head wind using a VOR instrument and the heading indicator.
| |
 |
|
 |
|
| |
(a) |
|
(b) |
|
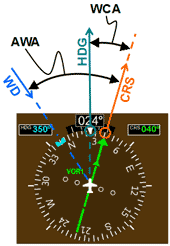
Fig 11 Visualizing a left head wind using an analog (a) and digital (b) HSI instrument.
In figures 10 and 11 we have the following configuration:
CRS = 040
WD = 350 (left head wind)
AWA = 50o
WCA = 16o
HDG = 040 - 16o = 024
Example 4
Fig 12 Visualizing a left tail wind using a VOR instrument and the heading indicator.
| |
 |
|
 |
|
| |
(a) |
|
(b) |
|
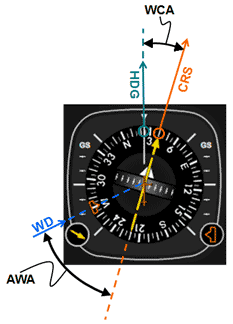
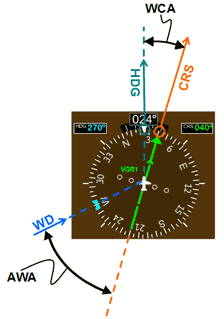
Fig 13 Visualizing a left tail wind using an analog (a) and digital (b) HSI instrument
In figures 12 and 13 we have the following configuration:
CRS = 040
WD = 270 (left tail wind)
AWA = 50o
WCA = 16o
HDG = 040 - 16o = 024
|

